Chapter 2: Validate and Record Your Email Metrics
In Chapter 1, we reviewed the basic setup components of a successful email marketing program and some ideas of where to go next. Beyond making sure that you have the basic components set up, the next question we have is: How is it doing?
Is my abandoned cart flow performing well? Am I getting the revenue from campaigns that I should be? Is my welcome flow working at turning my leads into customers quickly?
This time, we’re going to look at the key email metrics you should look at each week.
There are 11 metrics around your email marketing that we’ll be tracking:
- Campaign Open Rate
- Campaign Click Rate
- Campaign Bounce Rate
- Campaign Unsubscribe Rate
- Abandoned Cart Conversion Rate
- Bounce Back Flow Conversion Rate
- Welcome Flow Conversion Rate
- Subscriber List Size
- Engaged Subscriber List Size
- Customer List Size
- VIP List Size
In the section below, we’ll show you how to easily get each of these numbers.
Each week, review these stats and add them to your tracking. Copy this Google sheet to your account and update the numbers in there (File->Make A Copy). If you prefer Excel, you can download it instead and use that. The first tab is a templated sheet for your data, and the second tab has some charts that will fill in as we add in data.
The top row of the sheet has some guidelines on goals – these are what average performance typically looks like. This can help you understand if you’re performing at a decent level right now, and help prioritize areas where you might be below-average, as we post the follow-up sections on each chapter.
Each Friday, record the numbers in one row of the sheet. The next section has a walkthrough on where to get each number.
1) How To Get Your Numbers
A number of these metrics are easily measured through the Klaviyo Analytics Dashboard.
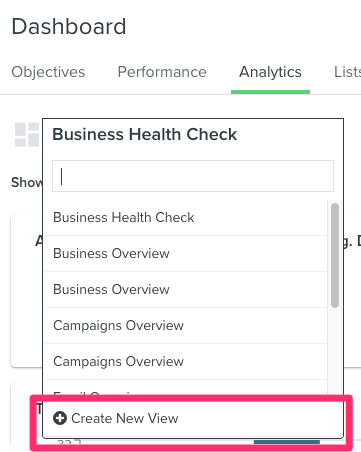
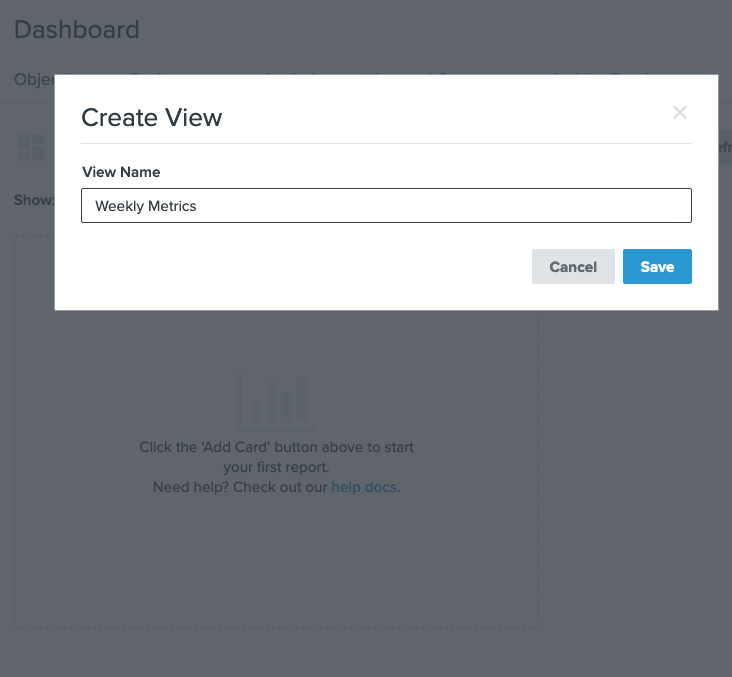
Click the Dropdown menu on the Analytics Dashboard and select “Create New View,” and name it “Weekly Metrics.”
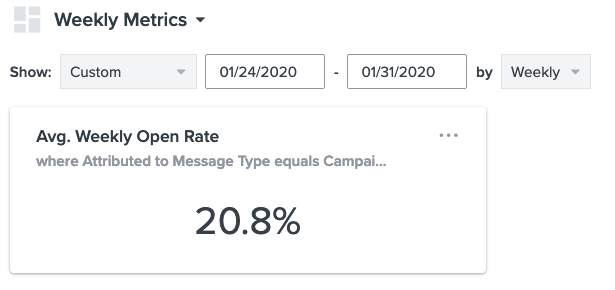
Each week, we’ll want to look at the total of the week’s data, so the date range at the top should reflect a full week and be set to “Weekly”, like this:
In the first section, we’ll keep a close eye on your overall campaign health. We won’t directly keep an eye on the purchase rate from campaigns. Since not every campaign is specifically about driving sales, we’ll stick to other metrics that make it easier to follow.
UPDATE:
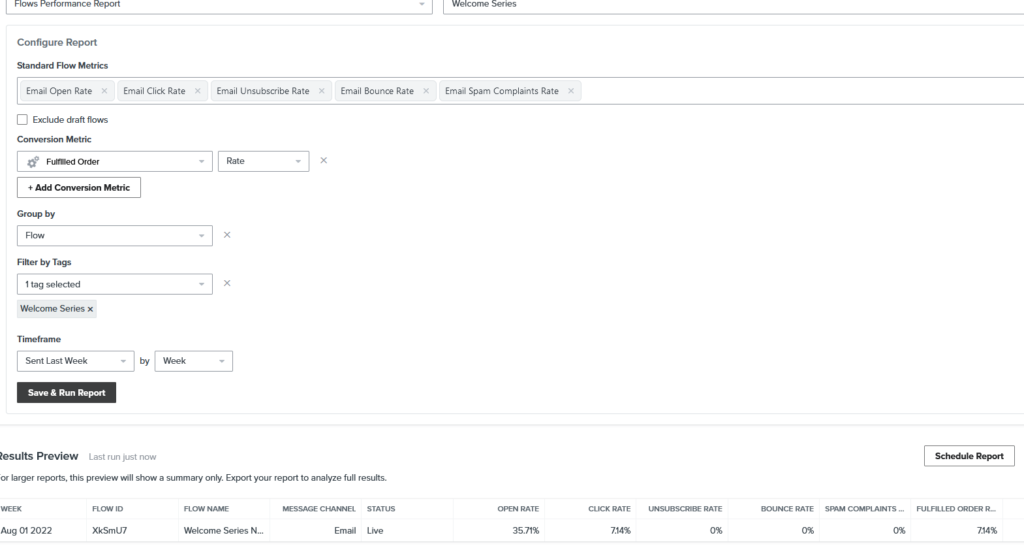
Since this guide was originally put together, Klaviyo has updated how you’re able to pull analytics. If you navigate to the analytics tab on the left panel and select custom reports. You can pull the metrics outlined into a custom view and save the report(s). Then all you have to do is run at the end of each week to pull the numbers for the Growth Guide Weekly Numbers.
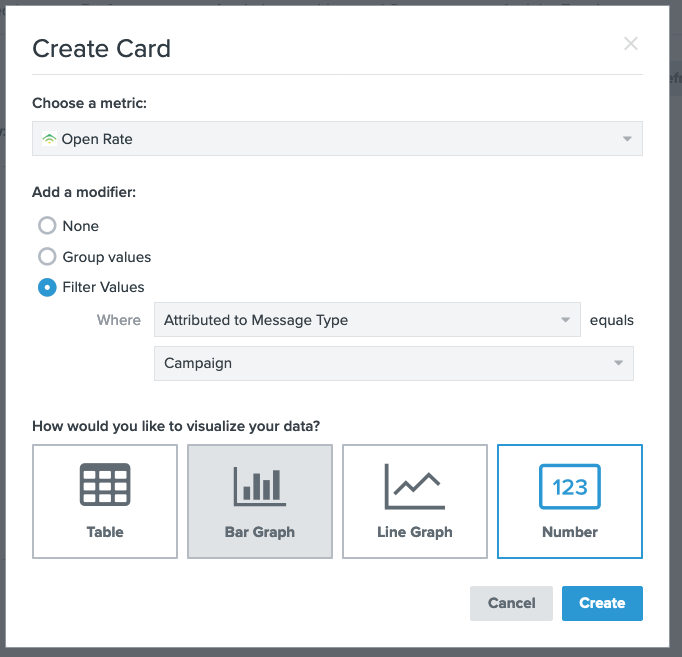
2) Campaign Open Rate
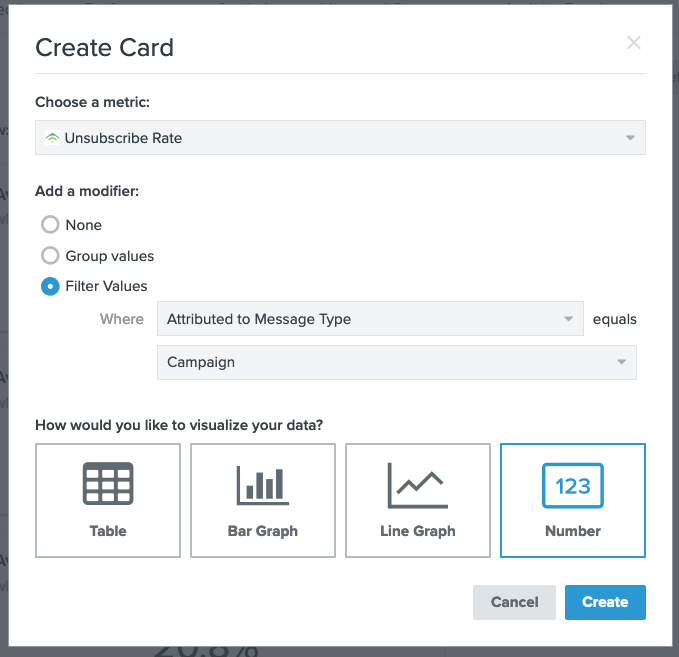
This is the number of campaign opens this week, divided by the number of campaign emails delivered. An easy way to get this number and then track each week is to create a Klaviyo Analytics Dashboard card for it. Here’s the card for Campaign Open Rate:
Which creates a Number card like this:
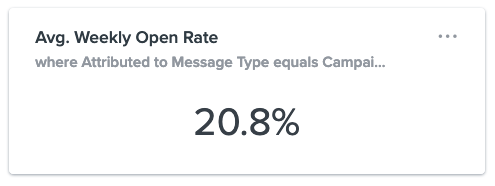
Record this in the first spot in the sheet. The next few metrics follow this pattern, so I’ll show you what the analytics card looks like for each one.
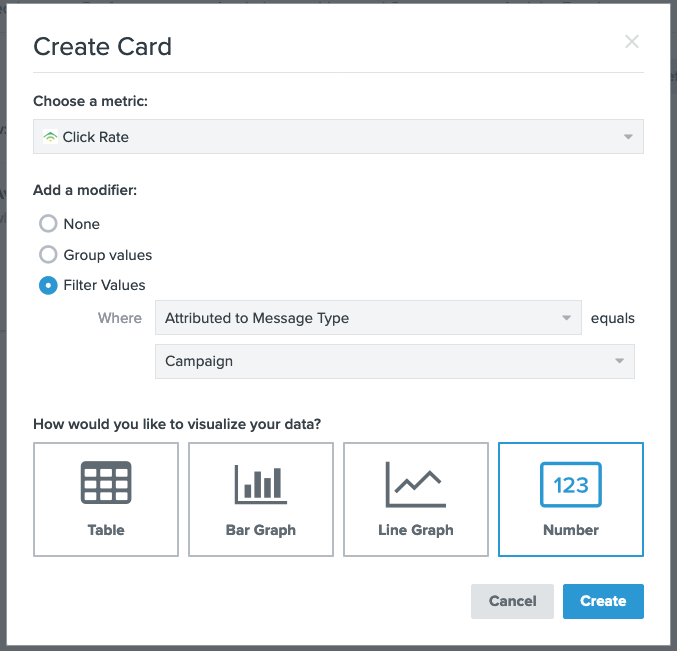
3) Campaign Click Rate
Your campaign click rate measures the share of campaign recipients that are interacting with the emails you send.
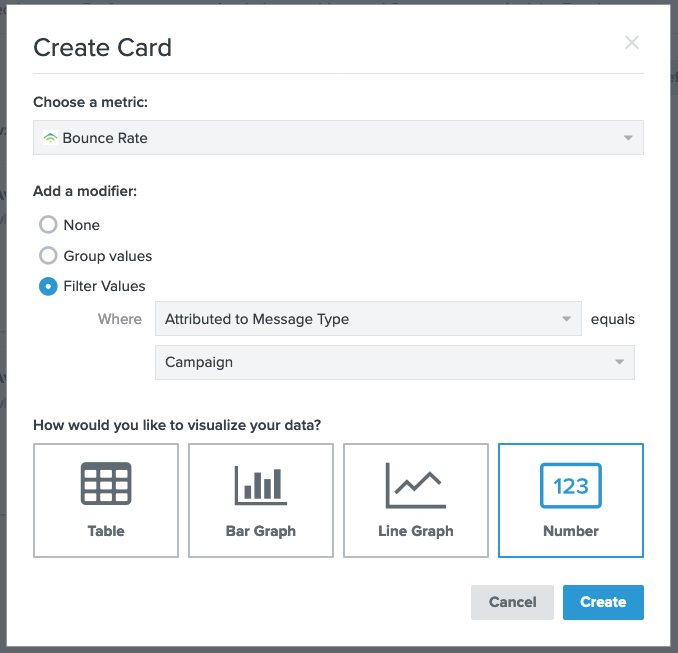
4) Campaign Bounce Rate
Campaign bounce rate measures how many recipients didn’t get each campaign you sent out because the address was undeliverable, didn’t exist, or other technical reasons. This is a critical measure towards keeping your email deliverability very high, and understanding if you’re collecting bad email addresses from somewhere, like a form that is collecting a lot of fake/bad addresses. Consistently high bounce rates will harm your deliverability, so it’s important to watch and make changes if you’re getting bad addresses into your list.
5) Campaign Unsubscribe Rate
Similar to bounce rates, it’s very important to keep an eye on your unsubscribe rate as a measure of overall health and interest in your email campaigns, and make changes if you’re starting to lose engaged subscribers.
The next section will help you assess how well your most critical sales flows are working for you. If you already have multiple flows of each type (like different abandoned cart flows for different product lines), you can track multiple of them here. For now, we’ll expect you are working with one of each type.
6) Abandoned Cart Conversions
Because Abandoned Cart flows are so closely linked to buying behavior, they typically have the best conversion rate of any of your marketing, and should definitely be your best and most reliable revenue-generating component of your email marketing. I see a lot of stores where just their abandoned cart flow pays for their Klaviyo account.
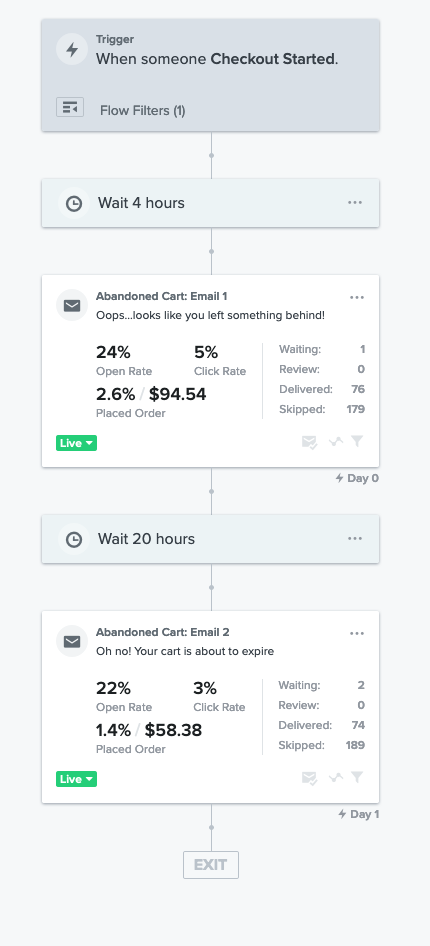
To get your conversion rate, just look down the flow path of your flow and sum the numbers under Placed Order on each card. If you have multiple Abandoned Cart flows or a branched abandoned cart flow, do this for the main path or where you see the most sending volume. Unfortunately, Klaviyo’s analytics dashboard doesn’t let you inspect the order rate by a specific flow or type of email.
For example, we’d consider this Abandoned Cart flow to have a conversion rate of 4.0% (2.6% + 1.4%):
7) Bounce Back Flow Conversion Rate
If you haven’t set up a bounce back flow yet, that’s okay! We’ll go over that when we get to it, or you can check out the Email Intensive Course Module on it.
Similarly to the abandoned cart flow above, look down the cards of your bounceback flow and sum the values.
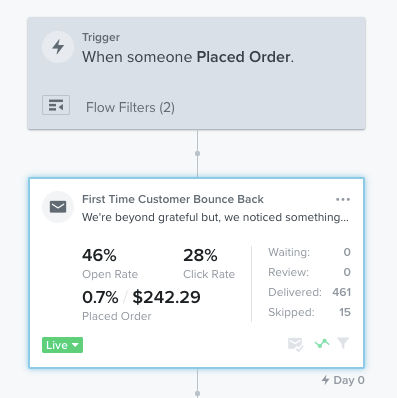
For example, we’d consider this Bounce Back flow to have a conversion rate of 0.7%.
8) Welcome Flow Conversion Rate
Your welcome flow is a key resource in converting new leads into first-time customers and introducing them to your brand and products. You can follow the same procedure as noted above for determining the conversion rate of this flow, and track what share of your leads are becoming customers off your welcome flow.
9) Subscriber List Size
You likely already have one list or segment that contains all of your opt-in subscribers. If not, check out how to set this up here.
To track this metric, check the size of that list or segment and enter it in Column I of the tracking document.
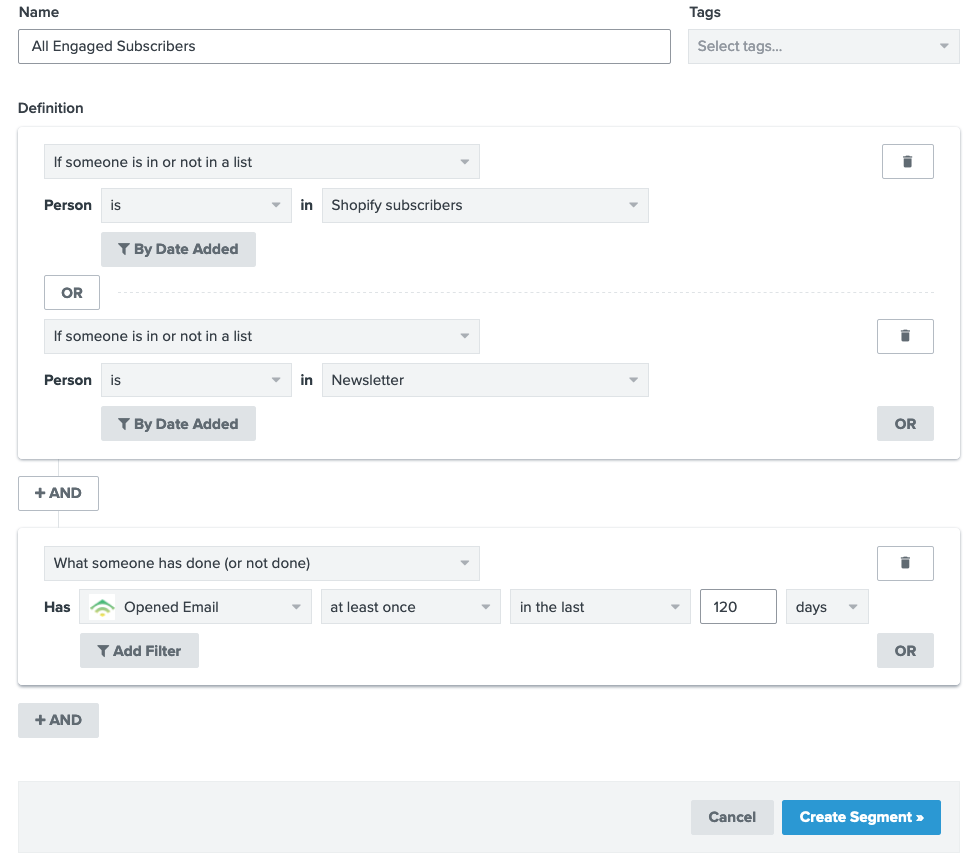
10) Engaged Subscriber List Size
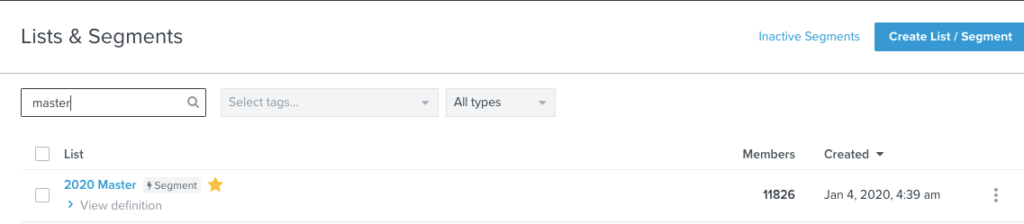
You also probably already have a segment that contains your engaged subscribers – the people typically receiving your campaign emails. If they’re cut up across a couple of segments because you send different campaigns to different audiences, either add them up and put them here, or make one more segment that’s just for measurement, not for sending, like this one:
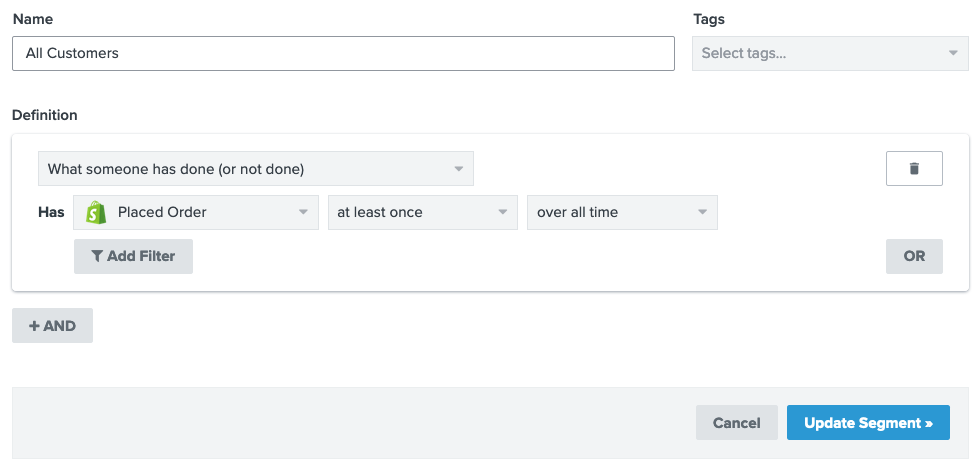
11) Customer List Size
Repeat the above steps and create a segment for all of your customers. This tracks the growth of your overall customer database.
12) VIP List Size
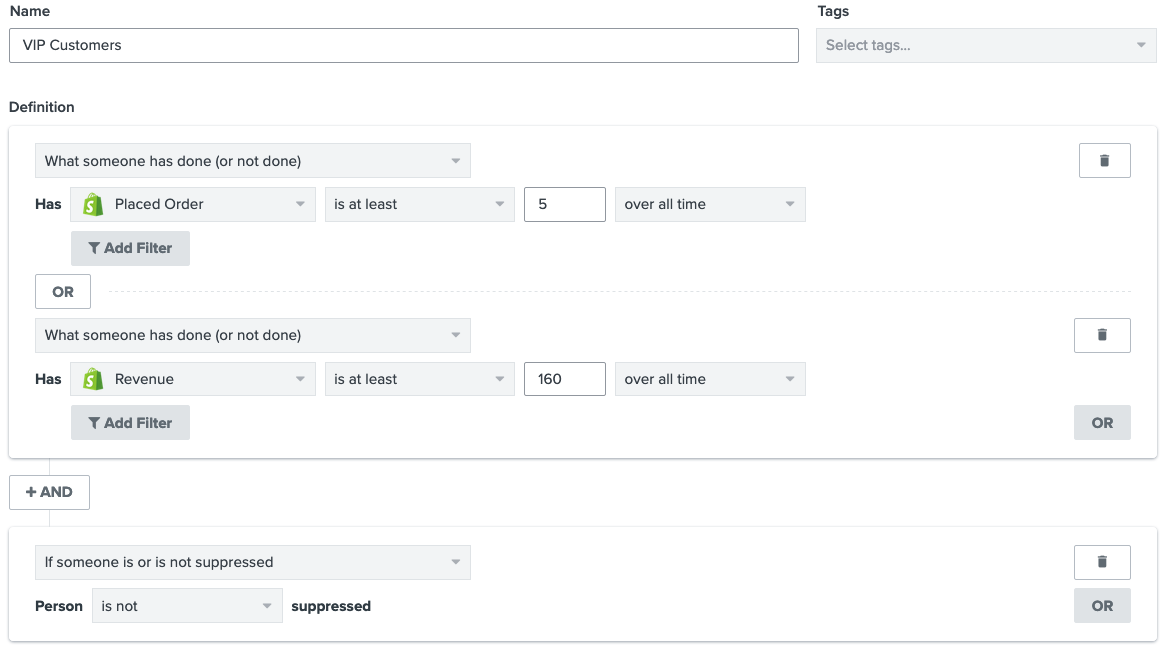
Your VIP customers are a critical resource in growing your business. This audience should be effectively churnproof, and you can develop a calendar for them that gets them to come back and buy on a regular basis without discounts, or with minimal discounting, and they are much more likely to refer or share you with friends. Let’s keep an eye on how many of them we could reach on a weekly basis.
I chose $160 in revenue as a good benchmark for someone having placed several valuable orders from this store… Picking 4x your average order value is a good way to get an idea of who your highest-spending customers are. You can also check out recommendations for how to build a VIP list using Klaviyo’s predictive analytics here.
The purpose of this segment is to identify who the customers are that are spending much more than your typical customer.
Congrats! You now have a complete weekly checkup for your email marketing and growth, and it’s set up in a way where you can check on these numbers in just a couple minutes each week.
Now that you have a good sense of where you are for each of these numbers, it’s easier to prioritize the areas that you need to improve. Each chapter in this guide will dive into one of these metrics, what it means, what good and bad look like, and how to improve.